
What Is a Descending Channel in Technical Analysis?
A descending channel is a bearish chart pattern that forms when a stock makes a series of lower highs and lower lows. Traders use this pattern to identify downtrends, potential buying opportunities, and important support and resistance levels.
Descending channels can appear on stocks like Strategy (MSTR), Bitcoin, and other financial assets.
How Does a Descending Channel Work?
A descending channel consists of two downward-sloping, roughly parallel trendlines:
- Upper trendline (resistance): Connects lower highs where sellers tend to enter.
- Lower trendline (support): Connects lower lows where buyers may step in.
As long as the price remains between these trendlines, the downtrend is considered intact.
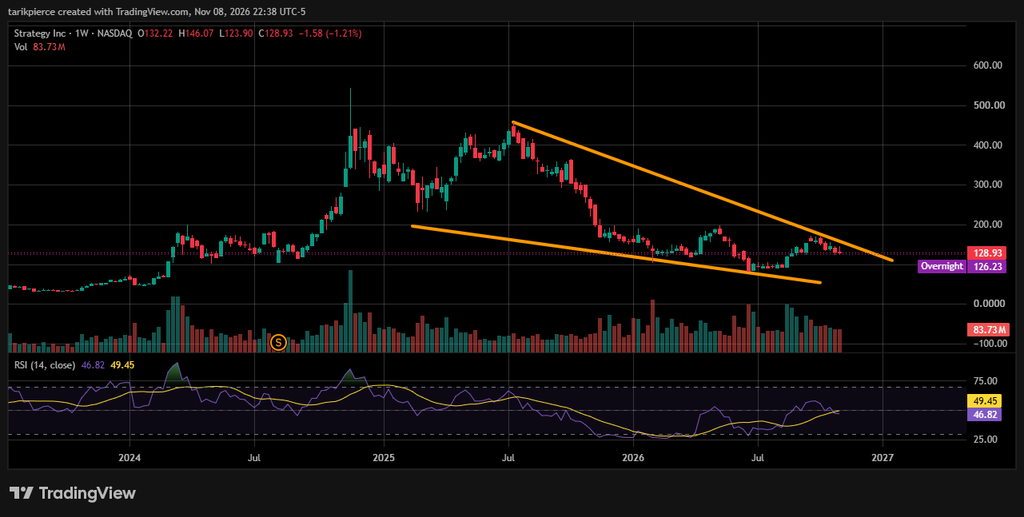
Here’s an example of MSTR stuck in a descending channel during the 2026 crypto bear market.
How to Trade a Descending Channel
Traders generally watch for three possible scenarios:
- Resistance rejection: Price approaches the upper trendline and reverses lower.
- Support bounce: Price approaches the lower trendline and rebounds.
- Channel breakout: Price breaks above resistance or below support, potentially signaling a change in momentum or an acceleration of the downtrend.
A breakout above the upper trendline may indicate a bullish reversal, especially when accompanied by increased trading volume.
Is a Descending Channel Bullish or Bearish?
A descending channel is generally considered bearish because the price continues making lower highs and lower lows.
However, a breakout above the channel’s resistance can be a bullish signal.
Traders often combine descending channels with the Relative Strength Index (RSI), moving averages, and trading volume to evaluate potential reversals.
Final Thoughts
Descending channels help traders visualize downtrends and identify potential support, resistance, and breakout opportunities.
For MSTR investors, recognizing these patterns can provide additional context when evaluating price movements and potential entry points.
Remember: Technical patterns are not guarantees. False breakouts can occur, and prices can continue falling even after reaching support.
